Trace
Visualize Cell Dependencies in Excel
by Christopher Teh Boon Sung
(updated: 24-Mar-2010 )
Latest (24 March 2010): Trace beta version 1.021
What is Trace?
Trace is an Excel add-in that draws one or more dependency graphs that depict relationships between cells. Consider the following trivial example in an Excel worksheet.
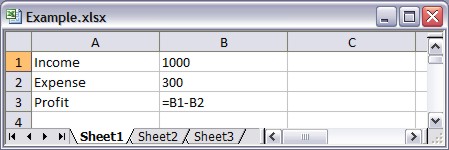
Profit (cell B3) is simply the difference between Income (cell B1) and Expense (cell B2). Trace produces the following graph to show the cell dependencies.
The title, "Sheet1", is the name of the worksheet. Ellipse nodes depict values (i.e., numbers or texts) in cells, and rectangle (or box) nodes depict formulas in cells. In this case, cells B1 and B2 have values of 1000 and 300, respectively, so they both have ellipse nodes. Node B3 is a box because cell C3 has the formula "=B1-B2". Also notice the direction of arrows going from node B1 to B3 and from node B2 and B3. This is because cell B3 require values from cells B1 and B2.
But what about cells A1, A2, and A3? Although they are not blank, they are unreferenced, so they are ignored by Trace, and they will not be drawn.
Cell names are also recognised by Trace and will be included in the graph. For example, let us define cell B1 and B2 with the names "Income" and "Expense", respectively. The formula in cell B3 can be written as "=Income-Expense".
Consequently, Trace produces the following dependency graph:
The names for their respective cells are now included within the brackets. We can see that the formula in cell B3 refers to cell B1 for "Income" and B2 for "Expense".
Now, consider the following example that uses cell ranges:
Cell B4 sums the values in cells B1:B3, and Trace produces the following graph:
The cell range B1:B3 is depicted as a parallelogram node. The reason for this is a cell range may encompass many cells, so drawing a node for each cell for that range could clutter the graph, making it more difficult to read and understand the various cell relationships. This is especially true for large graphs. However, if we have the following case:
In cell D2, a bonus of 2 points was awarded for Test 3 (cell B3), and Trace will now produce the following graph:
Cell B3 contains the formula "=30+D2", so it is drawn as a box. Cell B3 is also a part of the cell range B1:B3, so a dashed arrow is drawn from it to the parallelogram for cell range B1:B3. As cell B3 refers to cell D2, an arrow flows from ellipse node D2 to box node B1. As cell B1 and B2 are unreferenced by other cells other than by cell B4, no ellipse nodes are drawn for cells B1 and B2.
External links refer to references to cells located in another worksheet or workbook. Consider the following example in worksheet "Sheet3"
In "Sheet3", cell B3 refers to cells B1 and B2 to calculate the volume. However, cell B2 refers to cell B6 located in "Sheet2" for the radius value. In this case, Trace now draws the following graph:
External links are drawn by Trace as a "triple-layered octagon" or tripleoctagon. Here, cell B2 in "Sheet3" refers to cell B6 in "Sheet2", so a tripleoctagon node is drawn for the external link "'Sheet2'!B6". Notice that worksheet names are always enclosed by single quotes by Trace.
In drawing dependency graphs, we have the following choices:
- One graph for one worksheet
- One graph for all worksheets
In the previous example, there was an external link from node "'Sheet3'!B2" to node "'Sheet2'!B6". Choosing option (2) and combining the dependency graphs for "Sheet2" and "Sheet3" means that Trace will produce the following:
The name "Example" is the name of the workbook, and "Sheet2" and "Sheet3" are the names of the worksheets in the workbook. Previously, a tripleoctagon node was drawn for "'Sheet2'!B6", but because we have now combined the dependency graphs for both worksheets, cell B6 (now an ellipse node because it has a value of 2) stays within the "Sheet2" cluster, and an arrow flows from it to node B2 in the "Sheet3" cluster.
I include an example of a real mathematical model (GIF picture, 178 kb), done in Excel, for further illustration purposes.
Pre-requisites
Trace is an add-in that works in Excel ver. 2003 and 2007. It should also work in Excel 2002, but I have not tested Trace in this environment. Trace will definitely not work in Excel versions below 2002, or in operating systems other than Windows (sorry, Mac users).
In addition, you also require Graphviz, an award-winning and open source graph visualization software from AT&T Labs Research.
Download and installation
Currently, Trace is in beta version 1.021. Note that on some browsers, you might have to right-click on the download links and choose "Save Target As..." or the like.
|
|
|
|
Installation instructions here.
How to use Trace
It is quite easy to use Trace. Once installed in Excel, Trace will create its own menu. You will see three commands:
- Trace Workbook
Create one or more dependency graphs for all worksheets or those that you select. You can opt to combine the dependency graph for each worksheet into one graph. - Trace Selected Cells
Create a dependency graph for the cells you have selected. You can select one or more cells, or even select the entire workbook. Doing the latter, however, is the same as (1). - About Trace
Displays basic information about Trace and a shameless plug on its creator.
For every dependency graph, Trace creates a picture file (in GIF format) and a plain text file (*.txt) written in the DOT language. The GIF file can be viewed using any graphic software or even previewed using Windows Explorer.
More importantly, the text file (i.e., DOT files) can be read and interpreted by several applications provided in the Graphviz suite such as GVedit.exe and dotty.exe. There are also other software available for free that read these DOT files. Please see here for a list of DOT viewers/editors. Notable free software are such as ZGRViewer and TINTFU.
How much is Trace?
Trace is freeware. :)
Background
I created Trace mainly because I wanted one myself. I often use Excel for my work which involves a lot of number-crunching and mathematical modelling. I wanted a software that could depict the various cell relationships in a graphical form, but I could not find one that met my requirements. When I heard about Graphviz that could programmatically draws graphs, I thought this was half of my work done. But what I thought would initially be a simple and quick job soon ballooned into several weeks of blood, sweat, and tears of developing Trace.
I am not an Excel programmer or even a VB programmer, but I am an experienced C++ programmer. As Trace is written in my non-specialty language, I do not expect Trace's code to be super elegant, efficient, or bug-free.
Feedback
I anticipate bugs. This will most probably happen when Trace is run on computers set in another language or country settings. So I appreciate comments, suggestions, feedback, and bug-report. Please be kind and constructive in any negative feedback. Remember Trace is free, and I am busy with my own work (Trace is a hobby co-opted as work).
I can be contacted at: ![]() cbsteh@yahoo.com or visit my web page at:
cbsteh@yahoo.com or visit my web page at: ![]() http://www.christopherteh.com
http://www.christopherteh.com
History of changes
Beta Version 1.021 (24 March 2010)
- Bug fixed. Certain cell names are handled correctly now.
Beta Version 1.01 (4 June 2009)
- Users can now choose to include or exclude cell contents (values or formulas) in a diagram output. Excluding it can reduce clutter of large diagrams and aid readability.
- Previously, dot.exe was executed silently in the background. For large diagrams, this "invisibility" gives an impression of computer stall or freeze (i.e., "computer hang"). Consequently, Trace now runs dot.exe in a visible and separate window so that users may see dot.exe's progress especially during the creation of large diagrams.
- Changed Trace icons on the Excel 2007 Ribbon.
Beta Version 1.0 (1 June 2009)
- Initial public release.
Known issues
- Tracing large, complex spreadsheets will expectedly produce very large diagrams which may look like a "Flying Spaghetti Monster" map. Tracing large spreadsheets may also be time-consuming, depending on your computer set-up.
 See here for tips for tracing large, complex spreadsheets.
- Some functions like "OFFSET" complicate the tracing of cell relationships because of indirect routing to other cells. See here for more information on Excel functions to avoid.
Other Relevant Resources
- Graphviz Resource Page - Listing of tools that complement Graphviz, such as graph generators, postprocessors, and interactive viewers.
- Excel Add-ins, Templates and Resources - Find hundreds of Excel resources in Vertex42's Excel Nexus - The Ultimate Directory of Excel links.
- Ozgrid - Excel resource page.
- Systems Modelling Ltd. - Spreadsheet resources in particular those relating to spreadsheet auditing.
- Dependency Auditor - Traces cell precedents and dependents for spreadsheet auditing (shareware).
- EXChecker - Another tool (shareware) to trace cell relationships, but its company has folded. The program is still available and stored for historical purposes at Internet Archive.
- Viz!on - An Excel Add-In for Data Exploration and Visualization (commercial).
- Mathtools.net - List of Graphics and Visualization tools for Excel.
- aiSee - Graph layout program based on GDL language (commercial, or free for private use).
- nodeXL - Software for viewing and analyzing network graphs in Excel 2007 (open source).
- Spreadsheet Professional - an Excel audit tool that can, among others, visually map a formula's cell precedents and dependents (commercial).
- Fast Excel - a tool to trace bottlenecks in your Excel spreadsheet, so that you can modify or tweak it to make your spreadsheet run/calculate faster (commercial).
by Christopher Teh, Serdang
